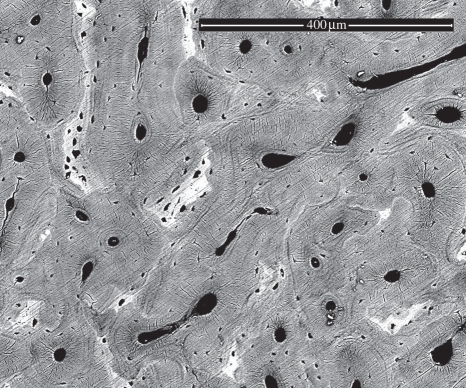
Figure 4.
SEM back-scattered image of the antler bone fracture surface. The light regions on the image indicate higher mineralization. The corresponding Ca/P ratio in the image varied from 1.48 to 3.12, indicating hydroxyapatite mineral is present [22,23], and the content varies throughout the antler bone.

