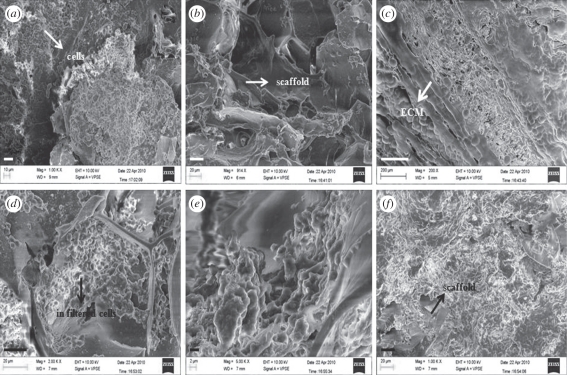
Figure 10.
SEM images of (a) implanted scaffolds after two weeks of implantation showing cells attached to the scaffold surface (b) after four weeks of implantation and (c) after six weeks of implantation showing degraded cryogel matrix and deposition of ECM. (d) Control scaffold after two weeks showing the attachment of infiltrated cells on the scaffolds; (e) control scaffold after four weeks; (f) control scaffold after six weeks showing the proliferation of infiltrated cells on the scaffold. Scale bars, (a) 10 µm; (b,d,f) 20 µm; (c) 200 µm; (e) 2 µm.

