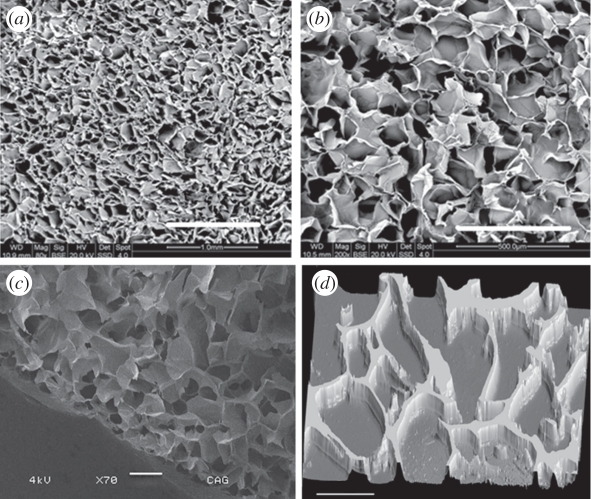
Figure 2.
Scanning electron microscopy (SEM) images showing microstructure of chitosan–agarose–gelatin CAG gels at (a) 80× and (b) 200× magnification. (c) Cryo-SEM image of CAG cryogels showing porous structure of the gel. (d) Fluorescence microscopic image of CAG cryogel section (thickness: 5 µm) analysed by staining with ethidium bromide. Scale bars, (a) 1 mm; (b) 500 µm; (c) 200 µm; (d) 100 µm.

