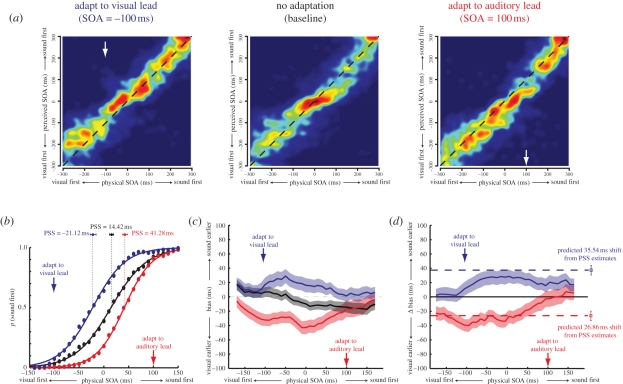
Figure 2.
(a) Image maps representing the distribution of estimates at each physical stimulus-onset asynchrony (SOA). ‘Warmer’ colours indicate higher probabilities. To aid clarity, the observed values have been convolved with an isotropic Gaussian smoothing filter (σ = 20 ms). The dashed black lines indicate veridical estimation. (b) Reconstructed psychometric functions for temporal order discrimination. The probability of perceiving the auditory stimulus as leading the visual stimulus is plotted as a function of SOA. Solid lines show the best-fitting logistic functions for each condition (colour coding as shown in figure 1). Clear evidence can be seen for a shift in the point of subjective simultaneity (PSS) towards the adapted asynchrony. (c) Biases of perceived timing induced by asynchrony adaptation. The mean bias (difference between physical and estimated SOA) is plotted as a function of SOA for each condition. (d) Shifts in mean bias from baseline are shown across the range of sampled SOAs. For comparison, the dashed horizontal lines indicate the pattern of results that would be expected if PSS shifts were representative of a uniform recalibration of perceived timing. In this and subsequent figures, shaded regions indicate the 95% confidence intervals.

