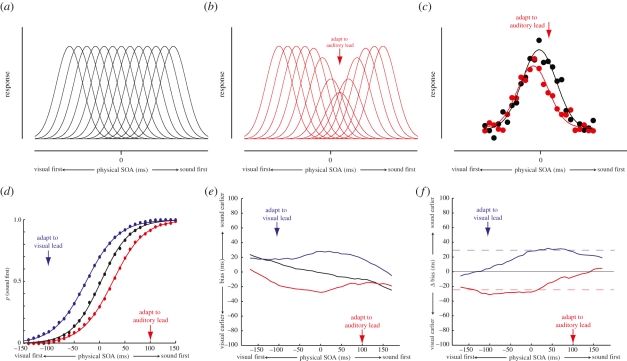
Figure 3.
Modelling the effects of auditory-visual asynchrony adaptation. (a) Schematic of a population code comprising neurons tuned to different auditory-visual stimulus-onset asynchronies (SOAs). In the best-fitting model, there were a total (n) of 29 neurons and each had a Gaussian tuning profile with an s.d. (σ) of 220.60 ms. (b) The effects of adaptation were modelled as a selective reduction of response gain around the adapted SOA. Best-fitting parameter values were a maximum proportional gain reduction (α) of 0.41 and a gain field standard deviation (σa) of 122.61 ms. See §2d for further details. (c) Examples of population responses to a physically synchronous auditory-visual stimulus (SOA = 0 ms). Data points represent individual noisy neuronal responses, plotted as a function of their preferred SOA. Asynchrony adaptation produces a repulsive shift of the population response profile away from the adapted SOA. (d) Psychometric functions for temporal order discrimination reconstructed from the simulated dataset, demonstrating the resulting shift in the point of subjective simultaneity. (e) Mean bias of SOA estimates in the simulated dataset as a function of SOA. (f) Shifts in mean bias from baseline for each of the adaptation conditions in the simulated dataset.

