Figure 4.
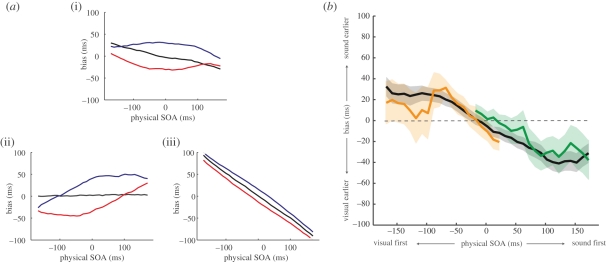
(a) Effect of changing the absolute number of neurons in the model population code. (i) Predicted patterns of bias of the best-fitting model, comprising 29 neurons with SOA preferences ranging from −700 ms to +700 ms. Evidence of a compressive bias can be seen in the unadapted baseline condition (black line). (ii) Increasing the range of preferred SOAs to ±2000 ms (81 neurons) while keeping all other factors constant removes the compressive bias from the baseline condition. (iii) Conversely, reducing the range of representation to ±500 ms (21 neurons) results in a magnification of the compressive bias. (b) Compression occurs around the point of simultaneity, rather than the centre of the response range. The black line shows mean biases in the unadapted condition for three observers, where the SOA of test stimuli was randomly drawn from a uniform distribution centred on physical synchrony (0 ms SOA). Comparable patterns of bias were obtained when the range of potential SOAs was offset by 150 ms (green line) or −150 ms (orange line), indicating that the locus of the compressive bias is an SOA near synchrony, not the centre of the response range. Shaded regions indicate the 95% confidence intervals.

