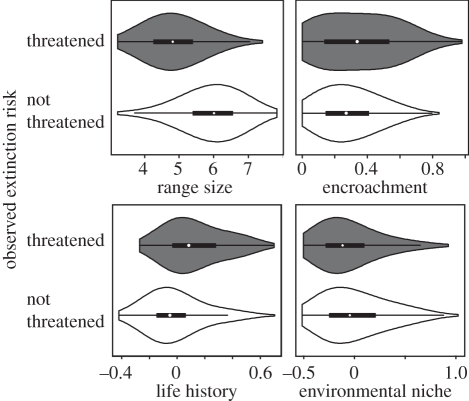
Figure 2.
Key correlates of extinction risk as identified from the main, within-family SEM model. Cross-species results are illustrated. These violin plots combine box plot and density trace (smoothed histogram of data) and embedded boxes indicate first and third quartiles, white circle the median, and horizontal lines 10th and 90th percentiles. Life history and environmental niche are latent variables whose effects are mostly driven by four predictors (electronic supplementary material, figure S1): species occupying low mean AET and high mean seasonality regions (i.e. high environmental-niche scores) are more threatened, and larger and precocial birds (i.e. high life-history scores) are more extinction prone.

