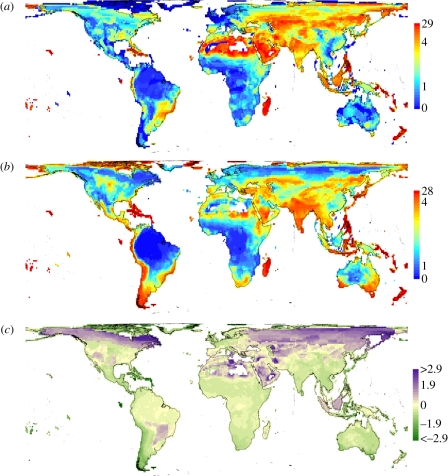
Figure 4.
The geography of extinction risk based on global occurrence of species across ca 13 000 110 × 110 km equal-area assemblages. Geographical patterns of (a) observed, (b) predicted percentage of threatened species and (c) observed–predicted in units standard deviation per assemblage. The predictions in (b) are from the species-based extinction risk probabilities of the within-family GLMM. In (c), areas in purple and green shades indicate under-prediction and over-prediction of extinction risk, respectively. Assemblages with less than 10 species are excluded.

