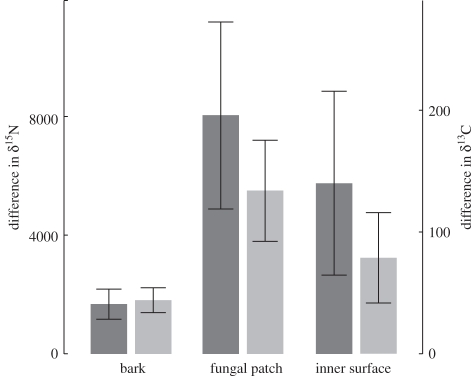
Figure 3.
Enrichment in 15N and 13C in the plant after deposition of a mixture enriched in the stable isotopes on three different surfaces: bark, fungal patch within domatia, inner surface of domatia (experiment 2). Values are differences between day 4 and day − 1 (day 0 being the day when the mixture was deposited). Means ± s.e. Dark grey bars, δ15N; light grey bars, δ13C.

