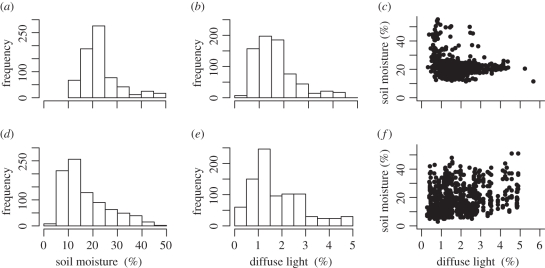
Figure 1.
Frequency distributions of soil moisture and diffuse light values for (a,b) the observational survey and (d,e) experimental plots, along with scatterplots showing the relationship between soil moisture and diffuse light for (c) the observational survey and (f) experimental plots. The variance inflation factors for soil moisture and diffuse light in the observational and experimental models were less than 1.5, indicating they independently predict variance.

