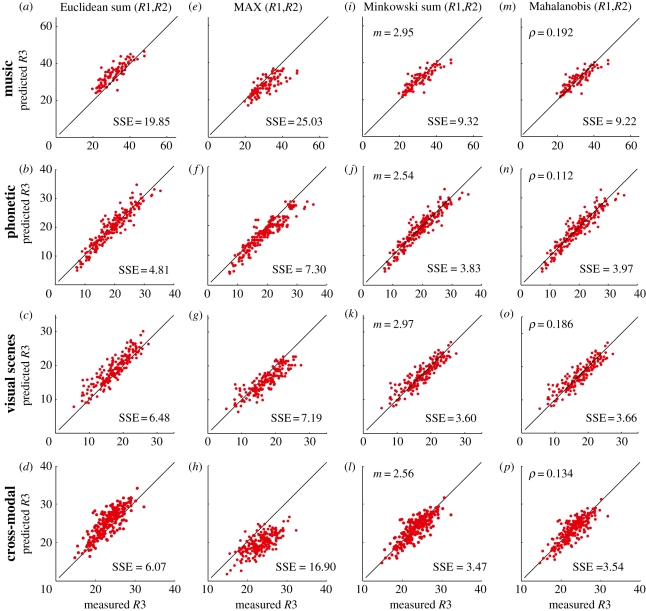
Figure 2.
For the separate music, phonetics, visual and cross-modal experiments, predictions of the rating (R3) given to the composite stimulus pair in a combination set calculated from the individual ratings (R1 and R2) for the two separate component stimuli. Lines of equality are shown. SSE is the summed squared error between predicted and actual R3 divided by the number of combination pairs in the experiment, and expressed as ‘squared rating units’. The results from experiments 1–4 are presented in the first, second, third and fourth rows, respectively. In (a–d), the Euclidean sum (when m = 2 in equation (3.1)) of R1 and R2 is plotted against the measured R3. In (e–h), the MAX (when m = ∞ in equation (3.1)) of R1 and R2 is plotted against the measured R3. In (i–l), the Minkowski sum (equation (3.1)) of R1 and R2 is plotted against R3 (the best-fitting Minkowski exponents are, m: 2.95, 2.54, 2.97, 2.56 in (i–l), respectively). In (m–p), the Mahalanobis sum (equation (4.1)) of R1 and R2 is plotted against R3 (covariance parameter, ρ: 0.192, 0.112, 0.186, 0.134 in (m–p), respectively).

