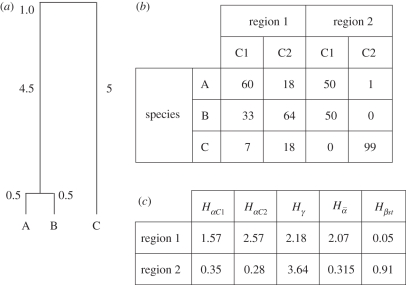
Figure 1.
A hypothetical case study illustrating the calculation of α-, β- and γ-phylogenetic diversities. (a) Phylogenetic relationships among three species in a regional pool. Phylogenetic distances (branch lengths) among pairs of species are indicated on the dendrogram. (b) Local abundances of species A, B and C in two hypothetical regions, each divided into two communities (C1 and C2). The total abundance per species and per site is indicated. (c) α, β and γ components estimated for each regional pool and each local community. HαCx: local phylogenetic diversity; Hγ: regional phylogenetic diversity;  : mean local phylogenetic diversity estimated on local communities; Hβst: phylogenetic turnover.

