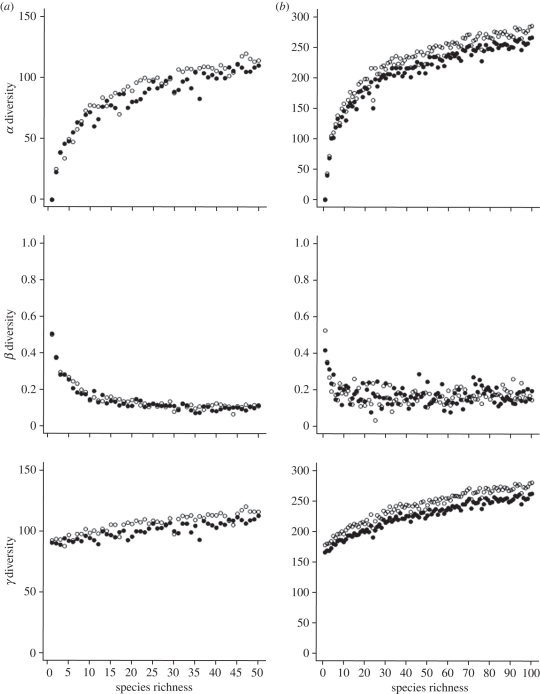
Figure 2.
α-, β- and γ-diversity values estimated on communities sampled among (a) 50-species or (b) 100-species trees generated under the Yule (closed circles) or PDA (open circles) model. α- (based on average local diversity values ( )), β- and γ-diversity values were calculated on pairs of communities composed of one 20-species community and one n-community (n ranging from 1 to 50 or 1 to 100 species depending on the regional tree size). β-diversity is expressed as the proportion of biological turnover (i.e. Hβst = 1 − [
 /Hγ]).

