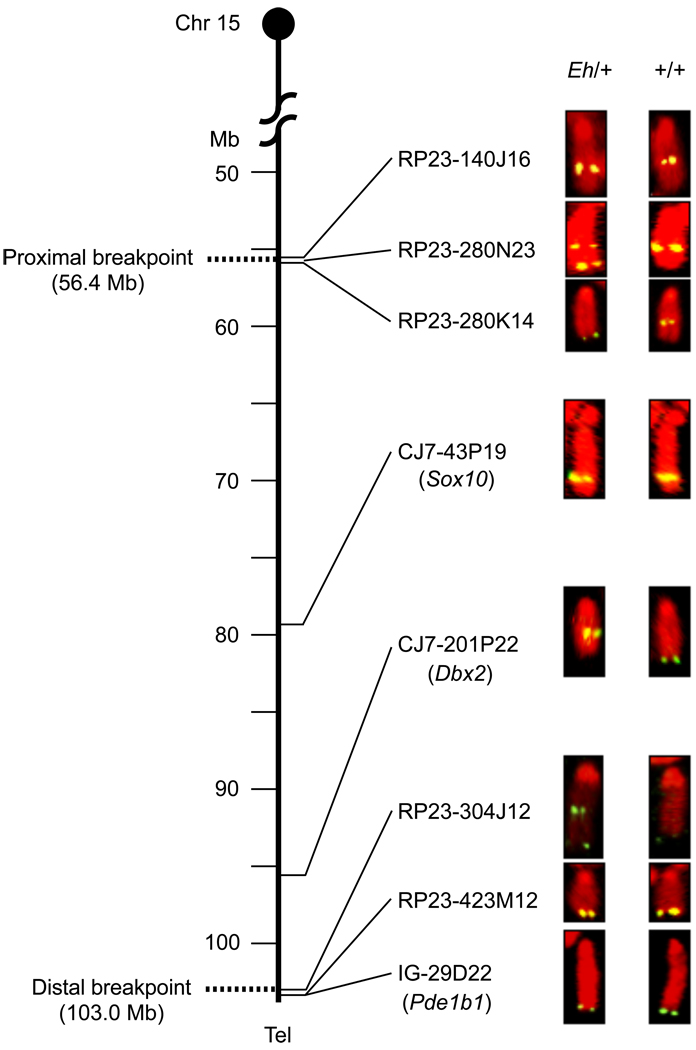
Figure 1. Fluorescent in situ hybridization (FISH) analysis of the Eh inversion breakpoints.
Summary of FISH analyses using BAC clones as probes on metaphase cell spreads prepared from an Eh/+ mouse. Chr 15 is depicted as the vertical line, with genomic positions in Mb shown on the left, and the centromere on top. Only selected BAC clones, and some of the markers (in the parentheses) that were used to identify them, are listed on the right of Chr 15, corresponding to their mapped positions. The BAC clones 280N23 and 304J12 generated two fluorescent signals in the inversion (Eh) Chr 15, indicating that these two BAC clones cover the proximal and distal Eh inversion breakpoints, respectively. These breakpoints are represented by dotted lines at positions 56.4 Mb and 103.0 Mb, respectively. RP23-: BAC clones identified from Roswell Park Cancer Institute mouse BAC library. CJ7-: BAC clones identified from Research Genomics’ CJ7 cell BAC library. IG-: BAC clone identified from Incyte Genomics Inc., BAC library. Tel: telomere.

