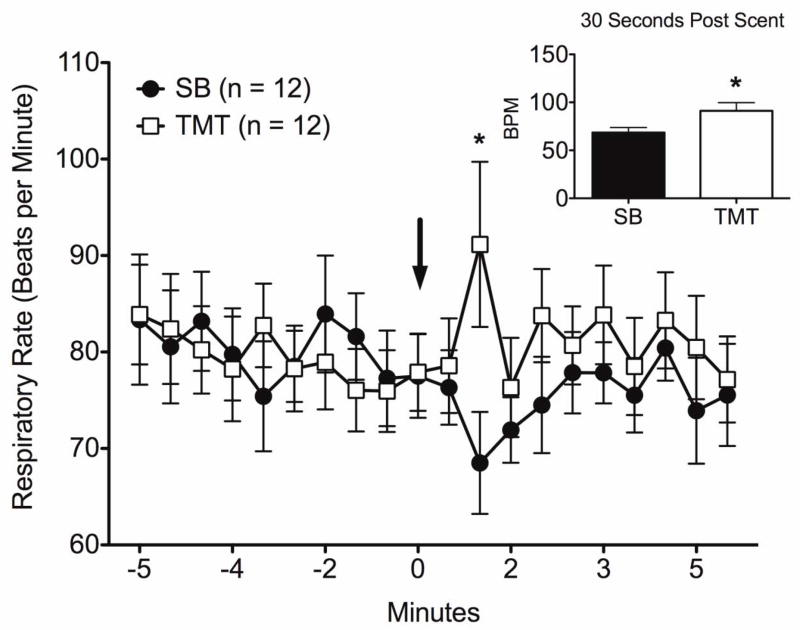
Figure 4.
Changes in respiratory rates measured non-invasively during presentation of SB and TMT in maternal rats. Data are shown for five minutes before and after the time of scent presentation during scanning. Asterisk represents significant difference for the specific time point using t-test (p = 0.03). Inset shows significant time point 30 seconds post scent presentation. All data are expressed as mean ± standard error.

