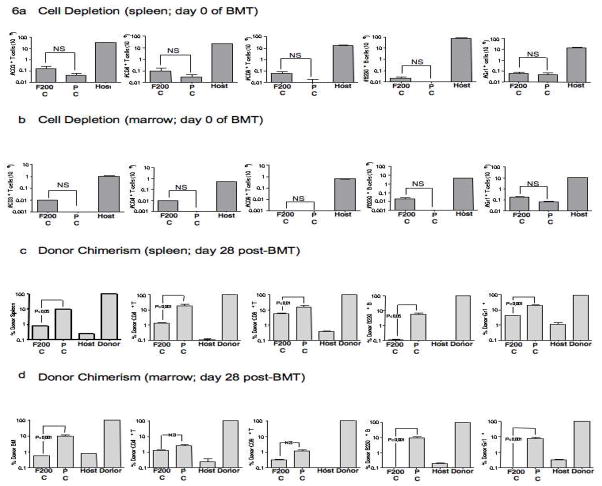
Figure 6. Alloengraftment after intensified PC and FC regimens (8-day regimen; increased fludarabine dosing).
Host B6 mice received either pentostatin (1 mg/kg on days 1, 4, and 7) or fludarabine (200 mg/kg on days 1, 4, and 7); each drug was administered in combination with cyclophosphamide (100 mg/kg/d, days 1 through 8; “F200C” regimen, “PC” regimen). After treatment, cohorts of mice were euthanized (n=10 in each cohort); spleen and marrow were harvested and the absolute numbers of post-conditioning CD3+ T cells, CD4+ T cells, CD8+ T cells, B cells, and Gr-1+ myeloid cells were quantified by flow cytometry. “Host” indicates cell subset numbers in untreated host mice. Absolute cell numbers (mean values ± SEM) in the spleen are shown in (a) whereas absolute cell numbers in the marrow are shown in (b) (NS, not statistically significant). Other cohorts of mice treated with the F200C regimen (n=10) and the PC regimen (n=5) were subsequently transplanted with T-cell depleted BALB/c bone marrow (20 × 106 cells). The percentage of donor/host chimerism was then determined by flow cytometry at day 28 post-transplant for total cells, CD3+ T cells, CD4+ T cells, CD8+ T cells, B220+ B cells, and Gr-1+ myeloid cells in the spleen (c) and in the bone marrow (d). “Host” and “Donor” values represent chimerism control values obtained from untreated host and donor mice; results are mean values ± SEM.

