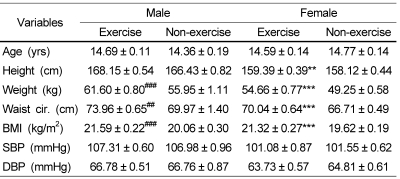
Table 2.
Anthropometric and blood pressure data for the subjects
Values are Mean ± SE.
##P < 0.01, ###P < 0.001: significant difference between the exercising male group and non-exercising male group
**P < 0.01, ***P < 0.001: significant difference between the exercising female group and non-exercising female group.

