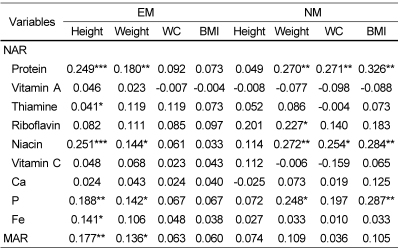
Table 7.
Correlations between nutritional adequacy and metabolic factor in male adolescent subjects
Values are Mean.
NAR = (The amount of nutrient intake/Recommended amount of nutrient); MAR = (The sum of N NAR / N)
*P < 0.05, **P < 0.01, ***P < 0.001: significant correlations between metabolic factors and nutritional adequacy. EM, exercising male group; NM, non-exercising male group

