
Figure 3.
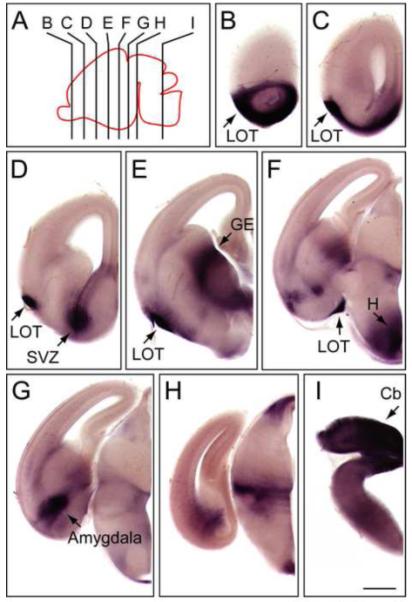
NdpAP expression in the E15.5 mouse brain.
(A) Diagram of an E15.5 mouse brain with the section planes shown for panels (B-I). Anterior is to the left. (B-I) AP stained 100 μm coronal brain sections from an E15.5 NdpAP/+ female embryo. The midline is at the right side of each panel. Cb, cerebellar primordium; GE, ganglionic eminence; H, hypothalamus; LOT, lateral olfactory tract; SVZ, subventricular zone. Scale bar, 500 μm.