
Figure 4.
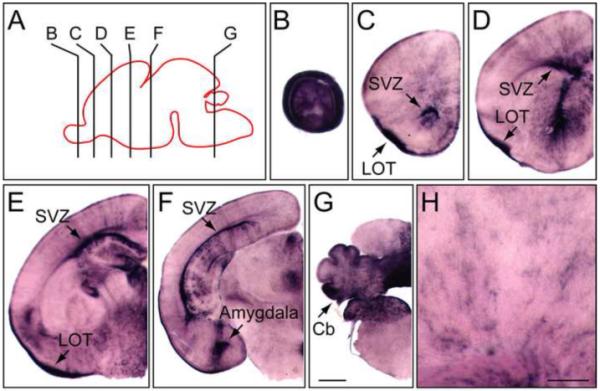
NdpAP expression in the P1 mouse brain.
(A) Diagram of a P1 mouse brain with the section planes shown for panels (B-G). Anterior is to the left. (B-G) AP stained 100 μm coronal sections from a P1 NdpAP/+ female mouse. The midline is at the right side of each panel. (H) Enlarged view of the cortex. Cb, cerebellum; LOT, lateral olfactory tract; SVZ, subventricular zone. Scale bars: B-G, 500 μm; H, 200 μm.