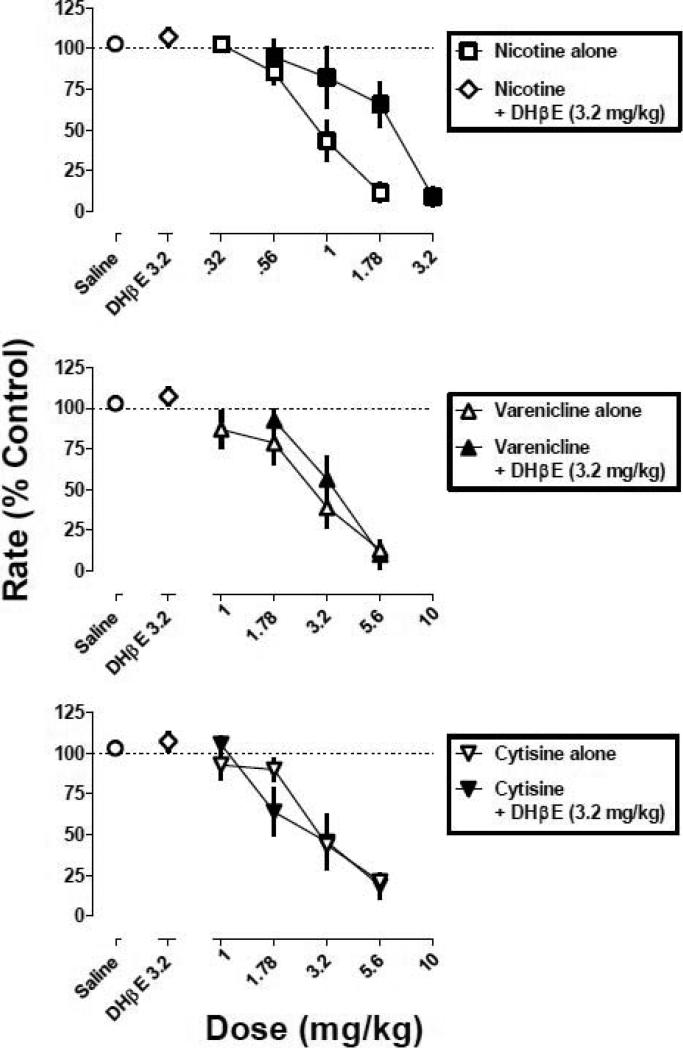
Fig. 6.
Dose-response curves for nicotine, varenicline, and cytisine, alone (circles) and in combination with DHβE (3.2 mg/kg; squares). Abscissa: dose in milligram per kilogram body weight or saline. Ordinate: mean (±S.E.M.) response rate expressed as a percentage of control (non-drug days) rate [Rate (% Control)]. Control curves (open symbols) are plotted from a subset of mice contributing to the control curve in Fig. 1.

