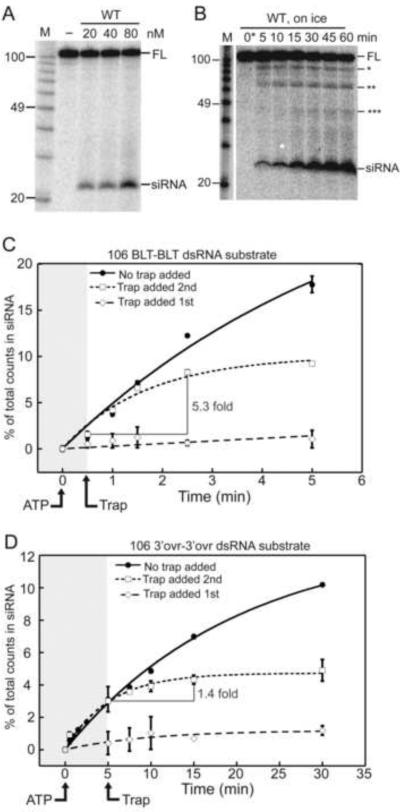
Figure 5.
Dicer-2 exhibits two modes of cleavage, depending on dsRNA termini. (A) PhosphorImage of products resolved by 12% denaturing PAGE after incubation of 0.5 nM 32P- internally-labeled 104 bp dsRNA in cleavage buffer (30 min; 24°C) with varying WT Dicer-2 and 5mM ATP. M, RNA decade markers, labeled for length (nts) by comparison to AH and P1 nuclease products of end labeled 32P-104 bp dsRNA. Mobility of full-length dsRNA (FL) and siRNA are marked. (B) As in (A) except WT Dicer-2 was constant (80 nM), reactions were on ice, and reaction time was varied. Asterisks, intermediates with one (*), two (**) or three (***) cleavages. 0*, aliquots taken immediately (≤ 10 seconds) after starting reaction with ATP. (C–D) Quantification of multiple “trap” experiments using 80 nM Dicer-2 and 0.5 nM 32P-internally labeled 106 BLT-BLT (C) or 106 3'ovr-3'ovr (D) dsRNA. All reactions were initiated by adding ATP (5 mM) followed shortly (30”,106 BLT-BLT; 5',106 3'ovr-3'ovr) by the addition of cold trap (2000 nM 82 BLT-BLT; squares), no trap (circles), or 32P-internally labeled dsRNA if 82 BLT-BLT trap was added first (open diamonds). Data points show (number of counts in siRNA / total counts in reaction)*100; error bars, standard deviation (n≥2); non-visible error bars, standard deviation < 0.25%. Data were fit to a pseudo first order equation: Fraction product = a*(1−exp−kt)+b; a=amplitude of rate curve, b=baseline (~0), k=pseudo first order rate constant, t=time. Shading boundary marks trap addition.

