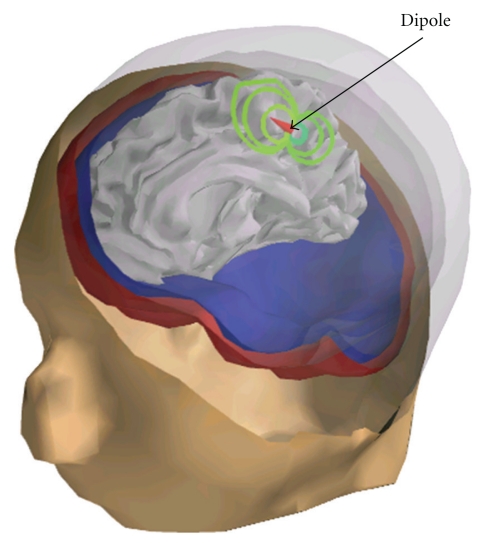
Figure 4.
Internal Potential simulation: visualization of the internal potential computed using OpenMEEG in a 3-layer head model. A dipolar source (red cone) is located in the left hemisphere of the cortex (not represented), and the curved lines are isopotential lines. A bending of the isopotentials near the skull can be observed.

