Figure 2.
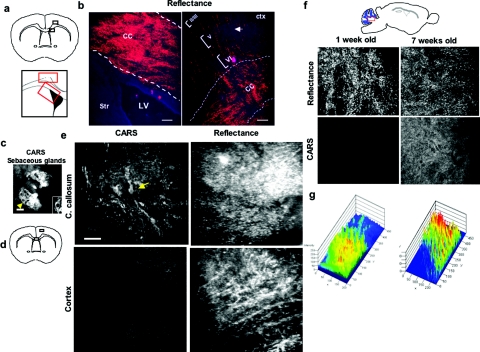
Combination of CARS and reflectance demonstrate axons and myelinated structures in the CNS. (a) Top diagram representing areas of the forebrain imaged by reflectance, corpus callosum (cc) and cortical layer II–VI. Bottom diagram shows the specific areas of the corpus callosum (radial projections) and corpus callosum near the dorsolateral wall of the SVZ used for imaging. (b) Representative image from a 12-μm histological section of corpus callosum in naïve mice (left panel), showing reflectance in cc, near the lateral ventricle (LV). (b) Right panel: Shows projections between corpus callosum and cortical layers II–VI (arrow). Bar = 200 μm. (c) Representative CARS image of sebaceous glands of mouse skin; note the clear detail of cytoplasm and nucleus of sebaceous gland cells (arrow) and (inset); bar = 200 μm. (d) Diagram of areas of forebrain used to simultaneously image CARS and reflectance. (e) Side-by-side analysis of CARS and reflectance in forebrain. The CARS signal is increased in white matter compared to gray matter (cortex), and the signals from reflectance are present in both cortex and corpus callosum. (f) Visualization of developmental myelination of cerebellum. Top panel shows the area of forebrain that was examined, the middle panels show cerebellum at one week or seven weeks old; the reflectance signal was present at both ages. However, the CARS signal is absent in cerebellum at postnatal day 5 compared to week 7. (g) Quantification of the intensity of CARS signal during developmental myelination in the cerebellum, measured by 2.5-D LSM software at postnatal day 7 (left panel) compared to postnatal day 50 (right panel).

