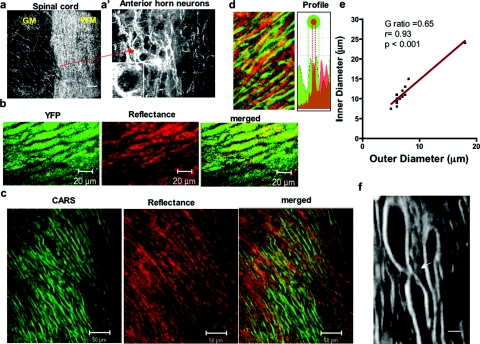
Figure 3.
CARS and reflectance demonstrate substructures of myelin. (a) Reflectance imaging of the spinal cord at the interface between white matter (wm) and gray matter (gm), showing the increased reflectance signal in the white matter of the spinal cord. (a′) Representative reflectance imaging of gray matter of the spinal cord (left panel) showing axon and dendrite arborizations with increased reflectance signal. The dark round profiles correspond to pyramidal neurons. Bar = 20 μm. (b) Representative imaging in the normal spinal cord of naïve mice showing colocalization of YFP and reflectance signals. (c) CARS imaging of normal myelin (green), reflectance (red), and merged picture. Note the alignment of the reflectance signal in myelin and axons. (d) Magnification of naïve spinal cord and Intensity profile of CARS and reflectance demonstrating segregation of the channels without overlap. (e) Linear correlation of inner diameter and outer diameter of multiple axons to determine the g ratio detected by CARS imaging, r = 0.93 with p < 0.001. (f) Visualization of node of Ranvier by CARS (arrow); an axon diameter of 10-12 m in the internodal region and 2 μm in the nodal region. (Color online only.)

