Figure 4.
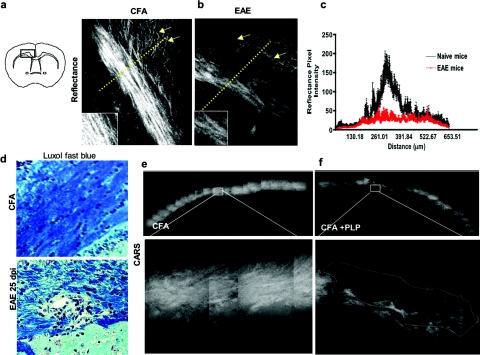
Combination CARS and reflectance demonstrate axonal loss and demyelination in the forebrain. (a) Reflectance imaging of the corpus callosum of control mice immunized with CFA (left panel) and EAE mice (right panel). (b) Callosal projections of cortical layers VI (arrows) and the corpus callosum exhibit a decrease in the overall signal of reflectance that can be appreciated as well in the inset. (c) Quantification of the covariance of pixel intensity of reflectance signals in explants of corpus callosum, the covariance [dashed line in (a) and (b)] in the mean and standard error of the mean multiple lines of pixel intensity (n = 12). Control mice exhibit a typical peak in the corpus callosum and the projection pathways that are decreased in EAE (red). (d) LFB staining of EAE mice (bottom) at day 25 compared to control CFA (Top). (e) Large-scale reconstruction of map of individual CARS images n = 25 from CFA animals, showing uniformity and increased CARS signal in the corpus callosum. (f) Visualization of large-scale map of corpus callosum in animals with EAE. A dark area of loss of CARS is indicative of frank demyelination. (Color online only).

