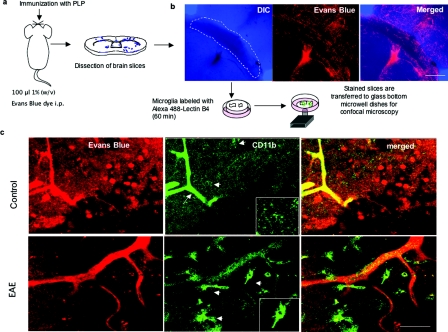
Figure 5.
Microdissection of forebrain tissue for ex vivo visualization of activated microglia in the SJL mice. (a) Diagram of methods used to stain microglia in brain slices with Alexa-488 IB4. (b) Representative confocal image of corpus callosum of EAE animals showing vessels and outlined area used for explants. (c) Representative image of the microglia in controls versus EAE animals in the corpus callosum of the SJL strain of mice; Evan blue stains vessels and lectin B4 stains microglia. In the control, there is strong staining in the perivascular microglia (arrow) and low in the parenchymal microglia (arrowhead). However in EAE, there is an increase in the staining (arrowhead), size, and numbers of parenchymal microglia cells compared to perivascular microglia cells (inset). These events are correlated with corpus callosum pathology as shown by CARS and reflectance imaging. Bars in b = 250 μm and in c = 30 μm. (Color online only).

