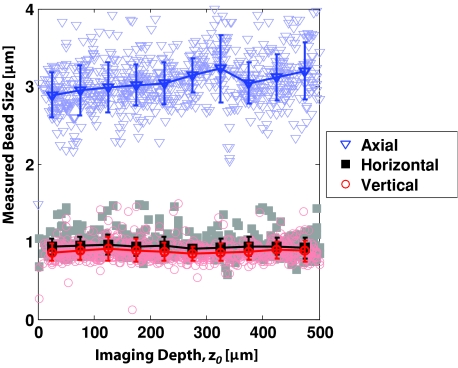
Figure 6.
Measured sizes of 1 μm diameter fluorescent beads versus depth for ls = 80 μm, χ = 300 phantom in the lateral and axial directions. The trend and error bars are calculated by the mean and standard deviations of sizes obtained by binning the beads at 50-μm depth increments. We observed no significant increase in bead size and, thus, in system resolution with increasing imaging depth in any of our phantoms.

