Fig. 3.
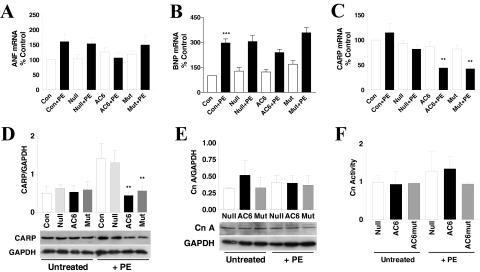
Phenylephrine-induced hypertrophy: phospholamban, CARP, and calcineurin. A, ANF mRNA was detected by qRT-PCR. AC6, but not AC6mut, reduced ANF mRNA expression after PE treatment. B, BNP mRNA was detected by qRT-PCR. BNP mRNA was increased by PE treatment in all conditions without group differences. C, CARP mRNA expression. Real-time RT-PCR was used to determine the expression of CARP, and mRNA copy number was expressed as a percentage over control (uninfected and without PE). Gene transfer of AC6 and AC6mut did not affect CARP mRNA expression. However, after incubation with PE, CARP expression was reduced by AC6 and AC6mut expression compared with the Ad.Null control (p < 0.05) or with uninfected control (**, p < 0.01). The p values are from post hoc Bonferroni t testing after one-way ANOVA. D, CARP protein expression. CARP protein was detected using anti-CARP antibody in immunoblotting and showed no group differences in the absence of PE. After PE treatment, AC6 and AC6mut expression reduced expression of CARP protein compared with both uninfected and Ad.Null controls (**, p < 0.01). E, calcineurin A protein expression. Calcineurin A protein was detected using anti-calcineurin A antibody in immunoblotting. There were no differences among groups in the basal or PE-treated conditions. F, calcineurin activity. Calcineurin activity was determined using the calcineurin cellular activity assay kit from Enzo Life Sciences. There were no differences among groups in the basal or PE-treated conditions. In all graphs, bars represent mean values of three to four experiments; error bars denote 1 S.D.

