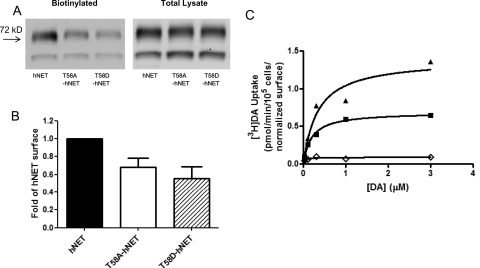
Fig. 1.
Surface expression and [3H]DA uptake in hNET and hNET-T58 mutants. Cell surface expression of hNET, T58A-hNET, or T58D-hNET was analyzed by biotinylation as described under Materials and Methods. A representative Western blot (A) and quantitation of surface transporter compared with hNET (B) are shown. Data represent mean ± S.E.M, n = 7. C, [3H]DA uptake (n = 3) was calculated in hNET (■), T58A-hNET (▴), and T58D-hNET (♢) by measuring initial rates at increasing concentrations of [3H]DA as described under Materials and Methods.

