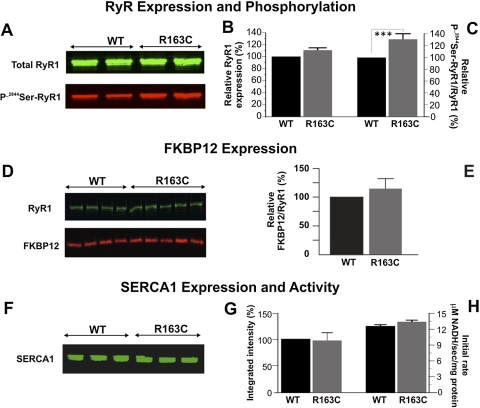
Fig. 4.
No differences in total RyR1, FKBP12, and SERCA expression were noted, but we observed enhanced phosphorylation of 2844Ser-RyR1 in preparations from R163C heterozygous compared with those from WT mice. A, representative Western blot from five independent preparations showing the expression of RyR1 probed with monoclonal 34C (total RyR1, green channel) and an antibody that selectively recognizes phosphorylated 2844Ser-RyR1 (P-2844Ser-RyR1, red channel). B, densitometry results show no differences between R163C and WT for total RyR1 protein expression. Bar graph represents the mean ± S.E.M. for n = 21 blots from seven membrane preparations. C, densitometry results show that R163C has significantly higher levels of P-2844Ser-RyR1 compared with WT. P-2844Ser-RyR1 signal (red channel) was normalized to total RyR1 (green channel) for each Western blot. The bar graph represents the mean ± S.E.M. for n = 29 blots from five membrane preparations. D, representative Western blot showing RyR1 (green channel) and FKBP12 (red channel). E, mean ± S.D. densitometry results from WT (n = 8) and R163C (n = 10) of two paired protein preparations. F, representative Western blot showing the SERCA1 expression from three separate preparations from WT and R163C mice. For each sample, 5 μg of protein was loaded per lane. G, mean ± S.E.M. densitometry results from n = 4 preparations per genotype replicated in triplicate. H, mean ± S.E.M. of the Ca2+-ATPase activity measured in an assay that couples Ca2+-dependent ATP hydrolysis to NADH oxidation (coupled enzyme assay) as described under Materials and Methods. The initial rate of NADH oxidation are shown for n = 6 determinations for WT and R163C. Specificity was assessed via TG; >95% of the initial rate of NADH oxidation was TG-sensitive.

