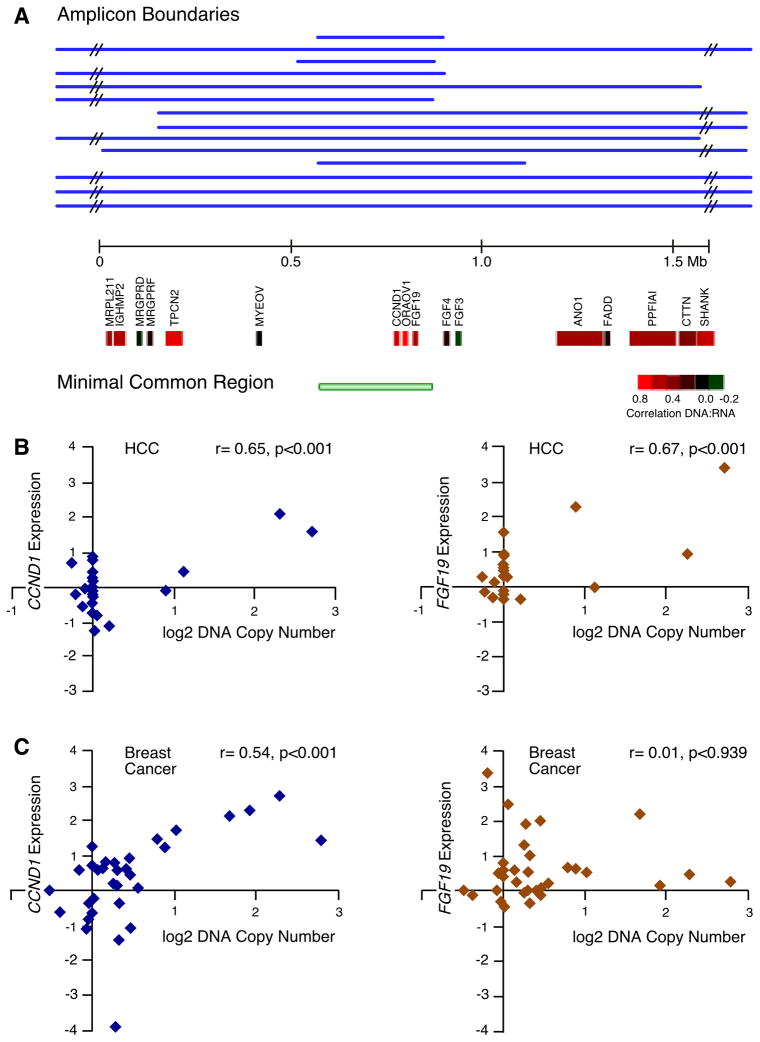
Figure 2. Epicenter mapping and expression of genes in the 11q13.3 amplicon in HCC and the difference in the effect of amplification on FGF19 and CCND1 expression between breast and liver tumors.
(A) Individual boundaries and the region of common overlap for the 14 11q13.3 amplicons, along with the underlying RefSeq genes in the depicted 1.5 Mb region, are displayed. The genes are color-coded (see inserted scale) to indicate the degree of correlation between DNA copy number and gene expression. Correlation coefficients between DNA copy number and expression are for FGF3 (r= −0.20, p=0.36) and FGF4 (r= 0.17, p=0.45), statistically insignificant in HCC. (B) Scatter plots with associated correlation coefficients showing the relationship in HCC samples (both tumors and cell lines) between DNA copy number and expression for CCND1 (left) and FGF19 (right). (C) As in (B) but with breast cancer cell line samples. See also Figure S3.

