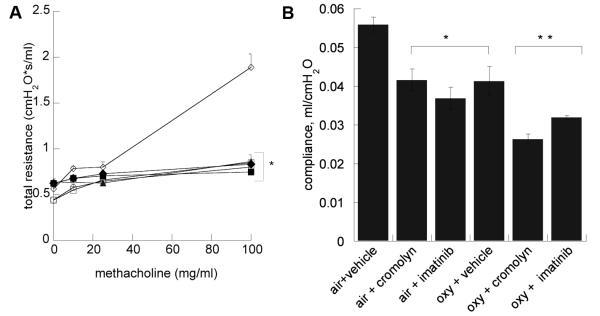
Figure 2.
(A) Respiratory system resistance in cromolyn and imatinib treatment groups compared to air and oxy + vehicle measured by forced oscillometry. □ air + cromolyn; ○ air + vehicle; ◇ oxy+vehicle; ▲oxy+cromolyn; ◆ air + imtinib; ■ oxy+imatinib. Data are means of 6 per group ± SEM. * p < 0.05 v. oxy + vehicle. (B) Respiratory system compliance (B) effects. Data are mean ± SEM. * p < 0.05 v. air + vehicle, **p<.05 v. oxy + vehicle.

