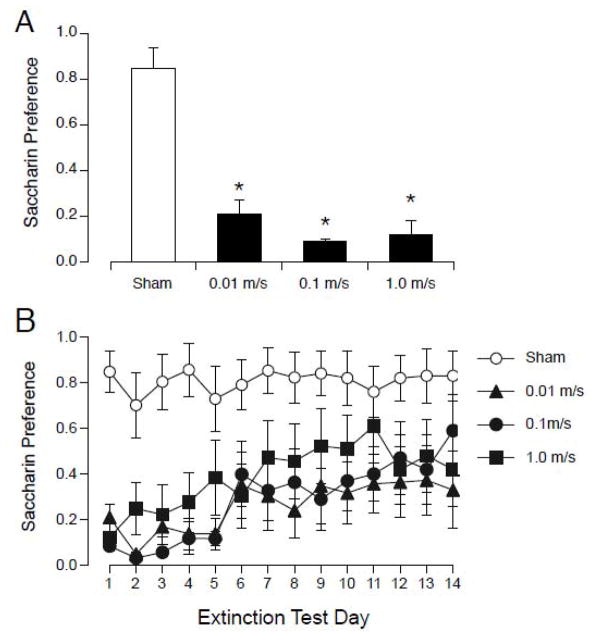
Figure 5.
Initial magnitude of CTA (A) and extinction (B) after pairing saccharin with sham-exposure or exposure to 14.1 T magnetic field with 3 different speeds of insertion and removal. A. On the first day of 2-bottle testing, all magnet-exposed groups (black bars) showed a significantly lower preference for saccharin compared to sham-exposed rats (white bar). B. Across 14 days of extinction testing, saccharin preference was not different among magnet-exposed groups. All magnet-exposed rats showed an initial CTA for saccharin that diminished over days.

