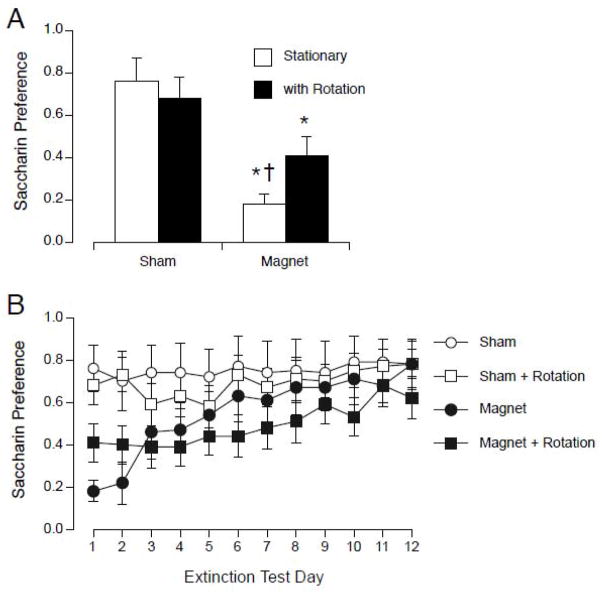
Figure 7.
A. Initial magnitude of CTA on the first day of 2 bottle testing after sham or magnet exposure while stationary (white bars) or rotating at 60 rpm during exposure (black bars). Both magnet-exposed groups showed a significantly lower preference for saccharin on the first day. Rotation alone did not induce a CTA. The group rotated during magnet exposure was not different from the group rotated during sham-exposure. * p < 0.05 vs. sham-stationary; † p < 0.05 vs. sham with rotation. (B) CTA Extinction across 12 days of 2-bottle preference testing. The sham-rotation group was not different from the sham-stationary group on any day, and the magnet-rotated group was not different from the magnet-stationary group on any day.

