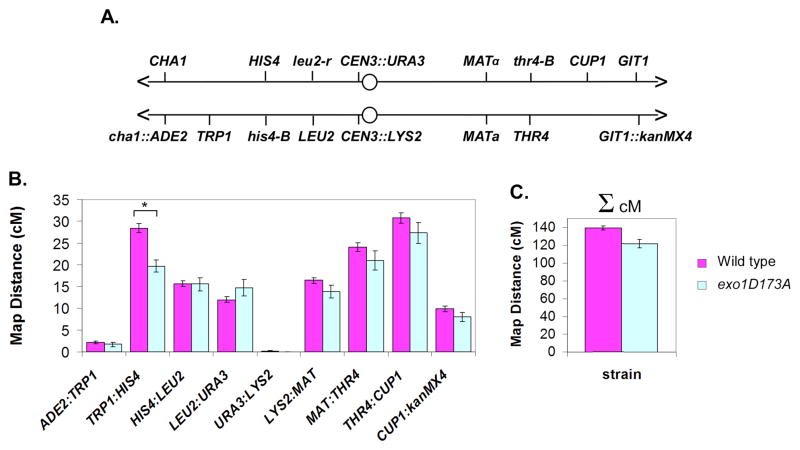
Figure 5. Crossing-Over Along Chromosome III in Wild-type and exo1-D173A Cells.
(A) Genetic intervals on chromosome III analyzed by tetrad analysis.
(B and C) Map distances (±SE) in wild-type and exo1-D173A cells. Asterisk indicates significantly different by G-test, p = 8 × 10⁻⁵ (see Table S2).

