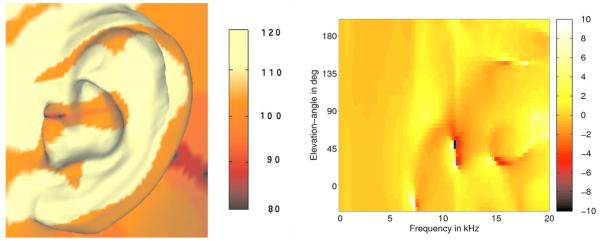
FIG. 11.
(Color online) Left panel: Sound pressure at the pinna for a 11-kHz point source located in front at the elevation angle of 45°. Right panel: Difference between the amplitude spectra of DTFs calculated for two different receiver elements (see text). The color represents the magnitude in dB. Differences larger than 10 dB and smaller than −10 dB are shown in white and black, respectively.

