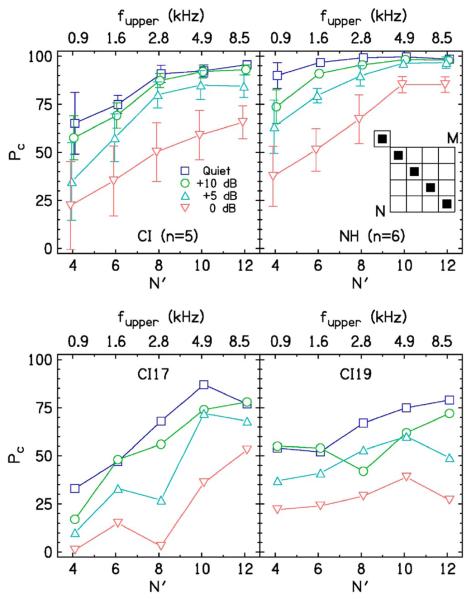
FIG. 3.
(Color online) Percent correct scores as a function of matched channels N′ (N= M) for five high-performance CI listeners (upper-left panel), six NH listeners (upper-right panel), and two low-performance CI listeners (bottom panels). The upper panels have errors bars that are two standard deviations in length.

