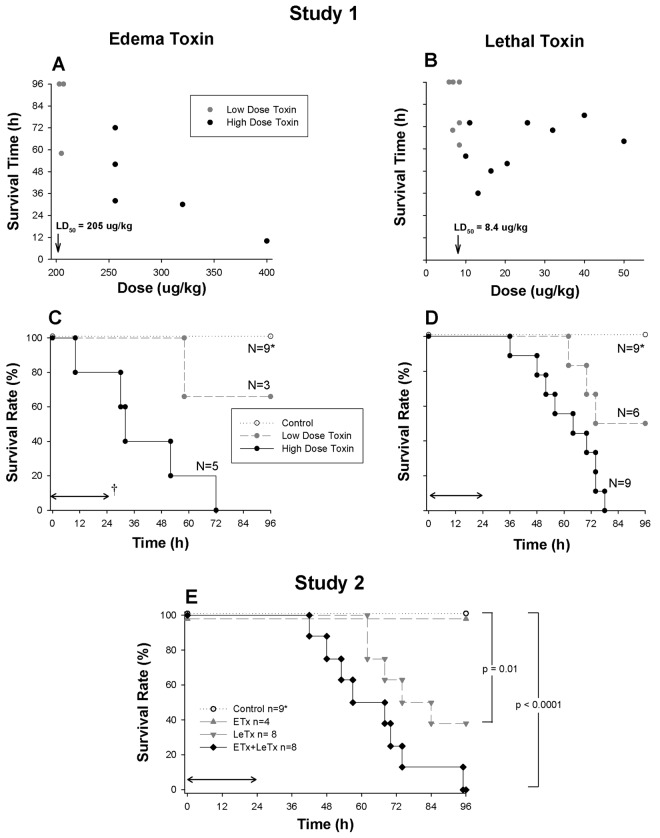
Figure 1.
A and B, Survival times associated with decreasing doses of edema (ETx) or lethal (LeTx) toxin in individual animals from study 1 (reported as the dose of edema or lethal factor used). Gray circles indicate doses that were associated with both survivors (survival time, 96 h) and nonsurvivors (survival time, <96 h), and black circles indicate doses for which no animal survived (termed low- and high-dose groups, respectively). C and D, Proportion of animals surviving over time with the administration of either low or high doses of ETx or LeTx or diluent only (controls) in study 1. E, Proportion of animals surviving over time in study 2, which compared LeTx and ETx alone or together with controls. Control animals (C, D, and E) represent animals investigated in both studies 1 and 2. The horizontal arrow (†) indicates the 24-h period over which toxin or control challenge was infused.

