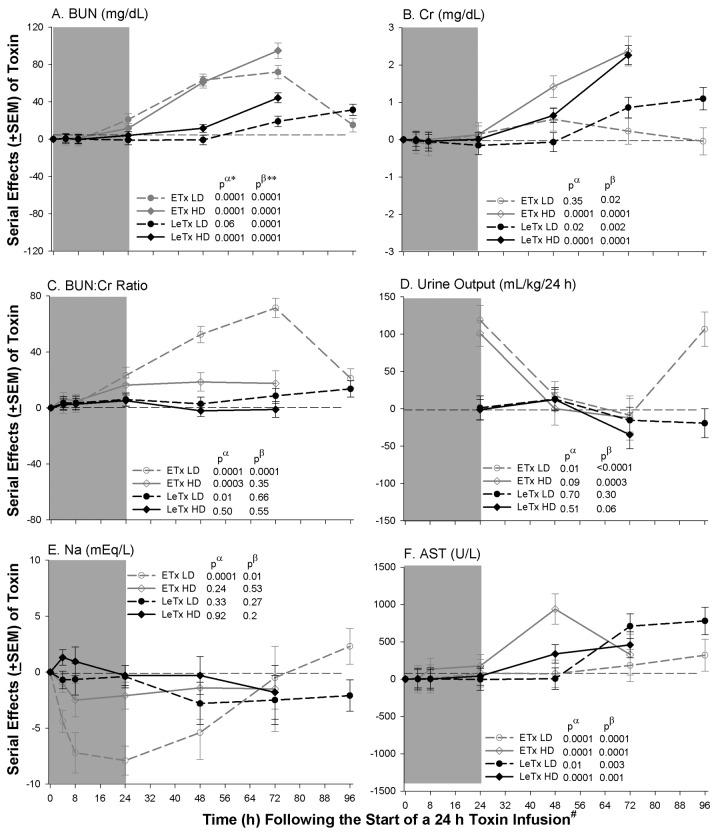
Figure 3.
Mean serial effects (± standard error of the mean) in a comparison of controls with low (LD) or high (HD) doses of edema (ETx) and lethal (LeTx) toxin on changes from baseline in study 1 for blood urea nitrogen (BUN) level, creatinine (Cr) level, BUN:Cr ratio, sodium (Na; 24-h urine output), and aspartate aminotransferase (AST) level. The format is similar to Figure 2.

