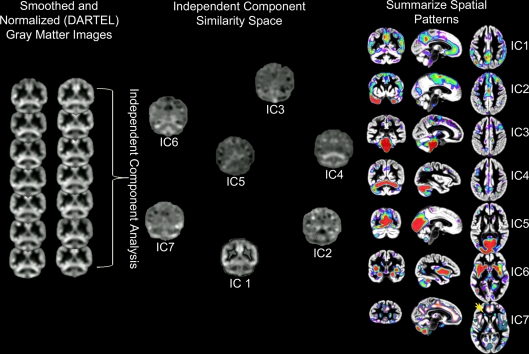
Figure 3.
Source based morphometry or ICA of gray matter probability images across 42 subjects. Each subject's T1-weighted image is segmented to generate a gray matter probability image that is normalized to a common coordinate space and smoothed. ICA is performed across the sample of gray matter images. The degree to which each independent component (IC) or unique pattern of variance can be compared to the other ICs with a variety of metrics, including an estimate of similarity space. The brain regions that contribute most to each component can be identified by displaying each component with scaled intensity values (Z score = 1–3 above). Each IC also has an inverse component or regions that are negatively correlated with regions in the IC. An example is presented for IC7 where white matter hyperintensity related segmentation error (yellow arrow) is identified by ICA and is inversely correlated with decreased frontal gray matter (e.g., anterior cingulate, anterior insula, and superior frontal sulcus regions represented by hot signal intensities above). ICs 4 and 7 are discussed below and were uniquely related to processing speed. This is important because these results suggest there are independent age-based sources that affect gray matter variation in cerebellar (IC4) and frontal (IC7) regions that are associated with processing speed.

