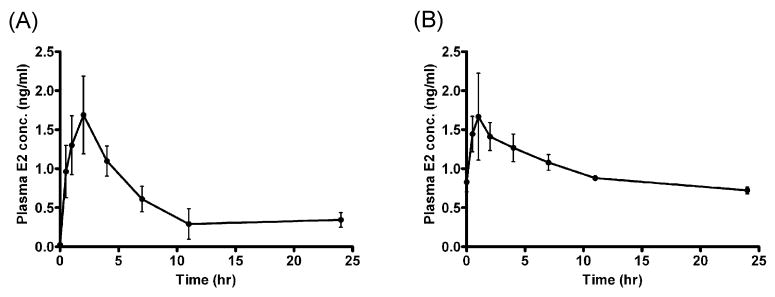
Fig. 1.
Plasma concentration of E2 vs. time profile after a single injection (A) and 5-day injections (B) of EB. Rats were administered with EB (1mg/kg subcutaneous injection), and blood samples were collected at various time points after EB administration. Concentration of E2 in plasma was determined by ELISA. The values are mean ± SEM (ng/ml).

