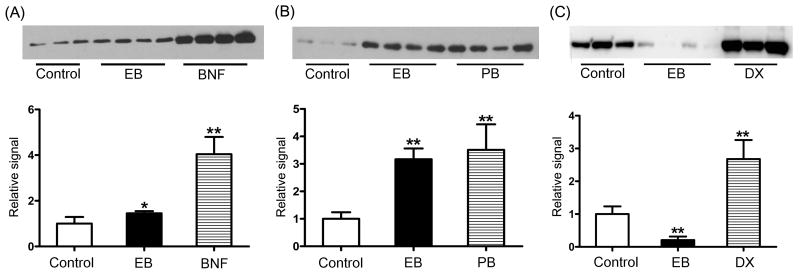
Fig. 3.
Effects of E2 on protein levels of CYP1A2 (A), CYP2C (B), and CYP3A1 (C). Western blot analysis was performed using hepatic microsomes prepared from rats administered with EB (1 mg/kg/day), BNF (40 mg/kg/day), PB (60 mg/kg/day), DX (60 mg/kg/day), or vehicle (corn oil) for 5 days. Eight micrograms of microsome from each treatment group were resolved on SDS-PAGE gel (8%). Results from quantitative analysis of the blots were shown at the bottom panel, expressed as relative signals in comparison with the control group (corn oil). *, p < 0.05; **, p < 0.01 vs. control.

