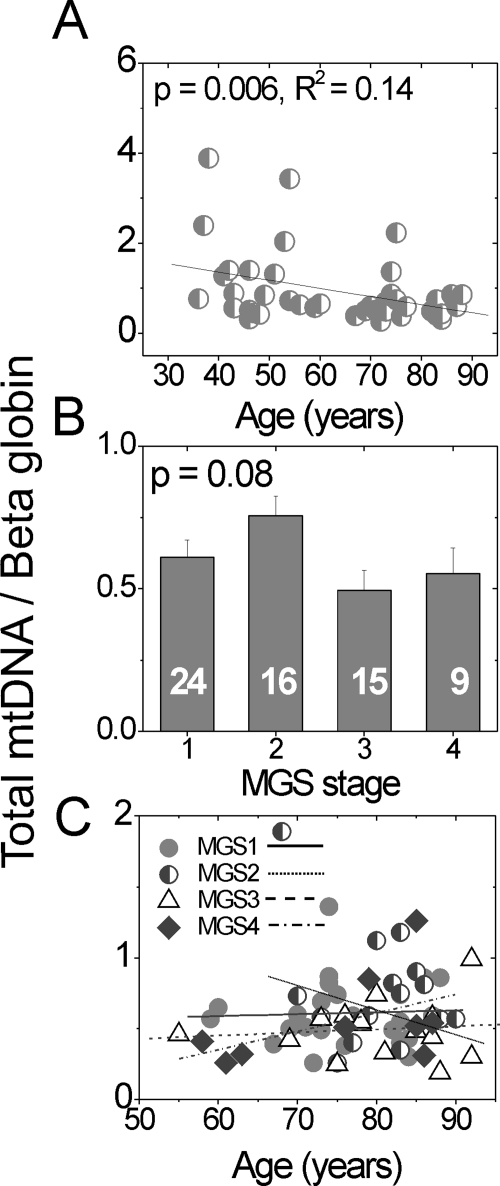
Figure 3.
The total mtDNA content decreases with aging, not with AMD progression. Total mtDNA content compared to β-globin was calculated from amplification of small regions of the mt genome (set 1, 16S rRNA; Fig. 2) and nuclear β-globin gene using qPCR. Total mtDNA content (A) of each MGS 1 (control) donor, ages 34 to 88 years (n = 44); (B) of each MGS stage (mean ± SEM); and (C) as a function of age for each MGS category. Linear regression analysis demonstrated no significant relationship between age and mtDNA content (C, P > 0.12) for any MGS stage. The number of samples in each MGS category is shown in the respective columns. The assay was preformed in triplicate.

