Figure 7.
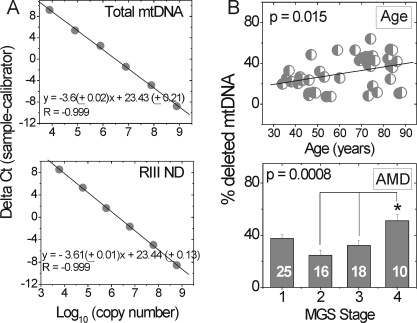
Deletions increased with aging and AMD. (A) The percentage of deleted mtDNA in each individual was quantified using standard curves generated for each primer set by serially diluting a known amount of copies. Template DNA for total mtDNA (primer set 1) and RIII ND primer sets were produced from ARPE-19 DNA. Equations shown were averaged from measurements repeated on 3 days. (B) Level of deleted mtDNA increased with aging (P = 0.015, R2 = 0.17, n = 44) and with AMD (P = 0.0008). The number of samples used for each MGS stage is reported in the respective columns. All reactions were performed in triplicate for each sample. *Significantly different from MGS 2 and 3.

