
Figure 5.
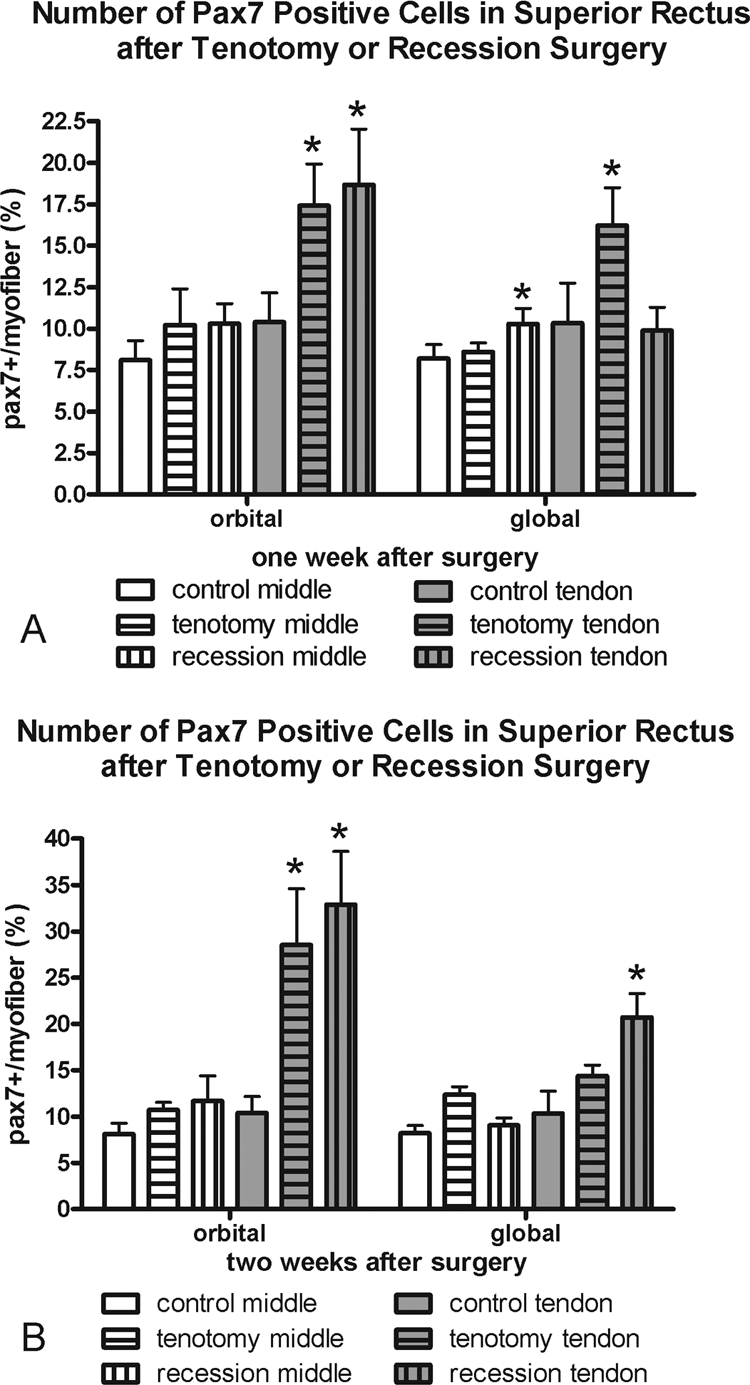
Morphometric analysis of the frequency of Pax7-positive cells (A) 1 and (B) 2 weeks after recession and tenotomy surgery compared with normal control superior rectus muscles. *Significantly different from the control. Data are expressed as the mean ± SEM.