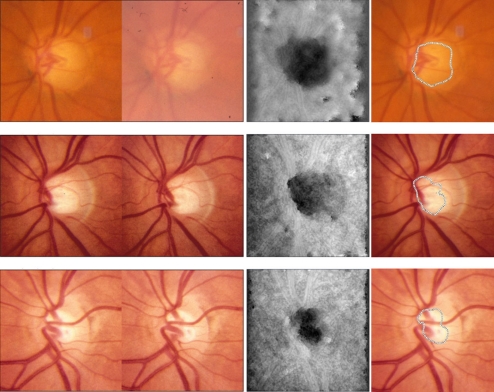
Figure 1.
Three pairs of stereoscopic optic disc photographs and their disparity maps produced by our multiscale stereo correspondence algorithm. The disparity of each pixel is shown as an intensity value in the disparity map (third column), in which darker pixel represents greater distance of the point to the camera. Shape features of the ONH are encoded in disparity maps without distractions from vascular features. One of the contour lines of the disparity map was superimposed on the reference (left) image (far right column) to delineate the bottom part of the estimated cupping. Accuracy can be verified by binocular fusion of the stereoscopic photographs (first two columns) by holding the page at approximately 30 cm (12 inches) from the eye and gazing into infinity.

