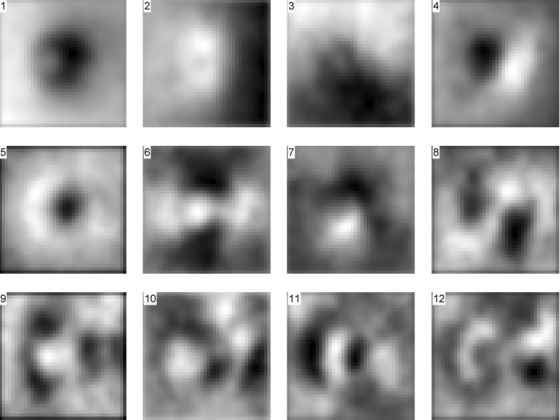
Figure 2.
Eigen disparity maps corresponding to the 12 largest eigenvalues of the covariance matrix in descending order. The first eigen disparity map represents the average shape of the ONH in the dataset. Given that the OS images are mirrored horizontally, the eigen disparity maps correspond to OD discs in which the temporal side is on the left side of the figure.

