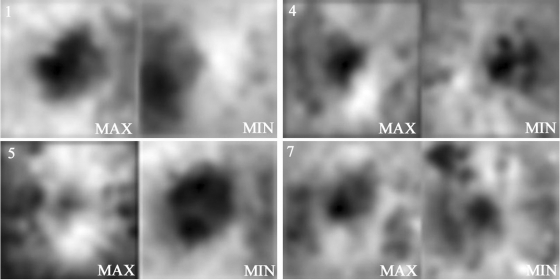
Figure 3.
Disparity extrema. Disparity maps with the maxima and minima coefficients associated with four salient eigen disparity maps (from top left to bottom right: 1, 4, 5, 7 displayed in Fig. 2) represent the ONH shape variability in this twin group.

