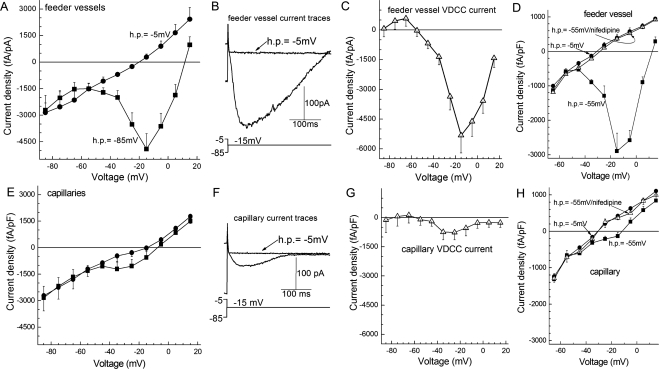
Figure 3.
VDCC currents in feeder vessels and capillaries of the retinal microvasculature. (A) Plots of the peak inward current density versus test potential recorded from abluminal (mural) cells located on the primary branch of feeder vessels (n = 7). Currents were generated from holding potentials of −85 mV (squares) and −5 mV (circles). (B) Current traces recorded from a feeder vessel mural cell during voltage steps to −15 mV from holding potentials of −85 mV and −5 mV. (C) Difference of the plots in A. (D) Effect of nifedipine on the relationship between the peak inward current density in feeder vessels (n = 4) and the test potential in experiments using holding potentials of −5 mV (circles) and from −55 mV. Squares: no nifedipine. Triangles: 10 μM nifedipine. (E) Plots of the peak inward current density versus test potential recorded from the abluminal cells (pericytes) of capillaries (n = 9). Currents were generated from holding potentials of −85 mV (squares) and −5 mV (circles). (F) Current traces evoked by a voltage step from a holding potential of −85 mV or −5 mV. (G) Difference of the curves in (E). (H) Plots of the peak inward current density versus test potential recorded from capillary pericytes (n = 3). Squares: No nifedipine. Triangles: 10 μM nifedipine.

